
Profit per project, department or cost center comes from analytic accounting: a second layer over your ledger that tags every cost and revenue line with the dimension it belongs to. Decide the dimensions first, let the operational apps do the tagging, and the question that stops the meeting gets a screen.
Your profit and loss looks healthy this quarter. Then someone asks the question that stops the meeting: which projects actually made that profit, and which ones quietly lost money inside the total? You do not have the answer on a screen. You have a feeling, a spreadsheet someone built once, and a finance person who can dig it out by next week. By then the loss-making project has run another month.
The general ledger answers "how much did we spend on salaries, materials, rent". It does not answer "how much did project Alpha cost versus what it earned", or "is the Rotterdam branch carrying the Amsterdam one". That second layer is what analytic accounting gives you. It sits on top of your normal bookkeeping and tags every cost and every euro of revenue with a project, a department or a cost center, so you can read profit per dimension without ever touching your real accounts. This is how you set it up in Odoo and, more importantly, how to set it up so the numbers are actually right.
Why your P&L cannot answer the question
A normal chart of accounts is organised by the nature of money: revenue, salary expense, material cost, rent. That is what the tax office and your accountant need. It is the wrong shape for the question "where did the profit come from", because the same salary line feeds five projects and the same rent covers three departments. Nothing in the ledger says which slice belongs to whom.
You can force the answer two ways, and both go wrong. You split the chart of accounts into "salary expense project A", "salary expense project B" and so on, which turns a clean chart into hundreds of accounts that your accountant hates and that break the moment you add a project. Or you export everything to a spreadsheet at month-end and allocate by hand, which is slow, manual, and out of date the day you finish it.
Analytic accounting is the third way, and it is the one Odoo is built for. Costs and revenue keep their normal account in the general ledger. On top of that, each posting carries an analytic tag that says which project, department or cost center it belongs to. One bookkeeping reality, two views: the legal P&L by nature, and the analytic view by whatever dimension you care about. You never duplicate accounts, and you never reconcile a spreadsheet.
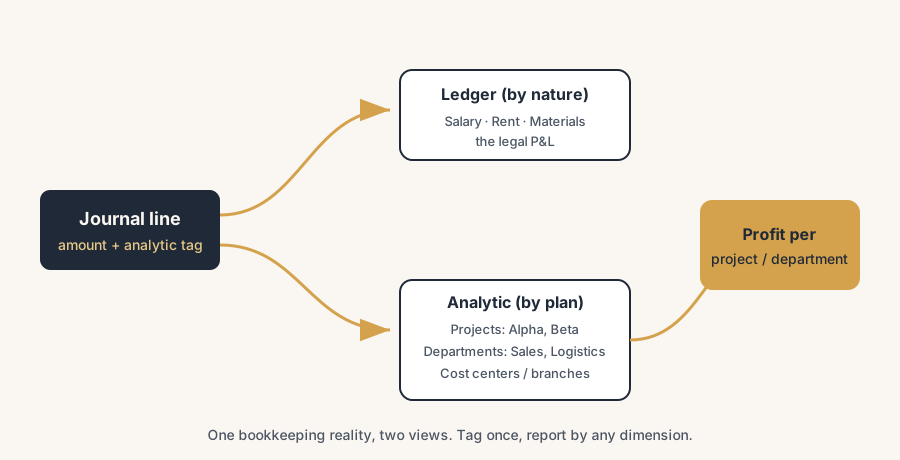
The fix, in steps
Turn on analytic accounting and decide your dimensions first
Enable it under Accounting > Configuration > Settings, in the Analytics section. Before you create anything, decide what you actually want to measure. That decision becomes your plans.
A plan is a dimension. An account is a value inside it. So the plan "Departments" holds the accounts Sales, Logistics and Marketing. The plan "Projects" holds one account per project. The plan "Branches" holds Amsterdam and Rotterdam. You can run several plans at once, which is the whole point: one cost can be tagged to a project and a department and a branch in the same posting, so you can later read profit by any of them. Decide these dimensions deliberately, because they are the questions you will be able to answer for years.
Create the plans and their analytic accounts
Go to Accounting > Configuration > Analytic Plans, create a plan (for example "Projects"), and add the analytic accounts under it. Each plan needs at least one analytic account to be usable. Keep the list of accounts short and stable. A plan with one account per live project is useful. A plan with two hundred historical accounts that nobody closed is a mess that makes the reports unreadable.
Decide how costs and revenue get tagged
This is the heart of it. An analytic posting (Odoo calls them analytic items) is created whenever a journal line that carries an analytic distribution gets posted. The distribution is the rule that says "this line is 100 percent project Alpha", or "60 percent Sales, 40 percent Marketing". You set that distribution in three ways, from most manual to most automatic.
- By hand on the invoice or bill. On a customer invoice or vendor bill line, open the Analytic column and pick the analytic accounts across your plans, then set the percentage. A bill that is fully one project is 100 percent that project. A shared bill splits across accounts by percentage.
- En masse on journal items. When the tag is missing on posted entries, select the journal items, open the Analytic Distribution column and add the distribution to all of them at once, then confirm. Useful for fixing a month you forgot to tag.
- Automatically with distribution models. Under Accounting > Configuration > Analytic Distribution Models you set conditions (an account prefix, a specific partner, a company) and the distribution that should apply. When a line matches, Odoo prefills the analytic distribution for you. Models can be combined and sequenced, so one line can pick up a distribution from several models that target different plans. This is what keeps tagging consistent once the volume goes up.
Let the operational apps feed the analytic accounts for you
You do not have to tag everything in Accounting. Odoo's other apps push analytic items in automatically when they are linked to an analytic account.
- A project linked to an analytic account sends its timesheets in as cost, and its invoiced work in as revenue.
- A purchase order or vendor bill for that project lands on the same analytic account as cost.
- A sales order for the project lands as revenue.
Connect the project to its analytic account once, and the day-to-day work tags itself. That is the difference between an analytic setup that survives and one that decays the moment people get busy.
Read the result and act on it
Open Accounting > Reporting > Analytic Items (the analytic report). Filter to the period, group by plan, then by analytic account, and you see cost, revenue and the balance per project, per department or per branch. Group by a different plan and the same data answers a different question. For project work specifically, the Project app also has a profitability view per project that reads from the same analytic data, so a project manager sees margin without opening Accounting.
The part that trips people up
A few things catch almost everyone
Analytic accounting is easy to switch on and easy to get subtly wrong, and a wrong analytic report is worse than none because people trust it.
Untagged postings vanish from the analytic view. Analytic items only exist for lines that carry a distribution. If half your costs go in untagged, your project looks more profitable than it is, because the costs landed in the general ledger but never in the analytic report. The analytic total will not match the P&L, and the gap is exactly your untagged spend. Distribution models on your main cost accounts are how you stop this.
Percentages have to add up, and shared costs need a rule. A line split 60/30 leaves 10 percent of that cost untracked. Worse, the real problem is overhead: rent, software, management time. These do not belong to one project, so either you accept they sit outside the analytic view (a clean choice) or you pick a deliberate allocation key and apply it with a distribution model. Allocating overhead by gut feel every month is how two people produce two different "truths".
Analytic accounting is not cost accounting for stock. Tagging a vendor bill to a project works for direct project costs. It does not value your inventory or compute product cost, which is the valuation engine's job. If you are chasing product margin, that is a different setup. Analytic accounting answers profit per project, department or cost center, not unit cost per product.
Plans and accounts are forever once you report on them. Renaming or merging analytic accounts after a year of postings rewrites your history and breaks the comparison you wanted in the first place. Decide the structure before you scale it, not after.
Quick checklist
- Have you decided your dimensions (projects, departments, cost centers, branches) before creating anything?
- Is each dimension a plan, with a short, stable list of analytic accounts under it?
- Do your main cost accounts have a distribution model so postings tag themselves?
- Are your projects linked to an analytic account so timesheets, purchases and sales flow in automatically?
- Does the analytic total reconcile to the P&L, or is there an untagged gap?
- Have you decided, on purpose, whether overhead is allocated or left out?
FAQ
What is analytic accounting in Odoo?
Analytic accounting is a second layer on top of your general ledger that tags every cost and revenue with a project, department or cost center, so you can see profit per dimension without changing your real accounts. Your legal P&L stays organised by nature (salary, rent, materials), and the analytic view answers "which project or team made the money". You enable it under Accounting > Configuration > Settings.
What is the difference between an analytic plan and an analytic account in Odoo?
A plan is a dimension you want to measure, like Departments or Projects. An analytic account is a value inside that plan, like Marketing or Project Alpha. Each plan needs at least one analytic account, and you can run several plans at once, so one posting can be tagged by project and by department and by branch at the same time.
How do costs and revenue get assigned to an analytic account?
Through an analytic distribution on the journal line, set three ways: by hand on an invoice or bill (pick the accounts and percentages), en masse on existing journal items, or automatically with distribution models that match on an account prefix, partner or company and prefill the distribution. On top of that, projects, purchase orders and sales orders linked to an analytic account feed their costs and revenue in automatically.
How do I report profit per project or department in Odoo?
Go to Accounting > Reporting > Analytic Items, filter the period, and group by plan and then by analytic account to see cost, revenue and balance per project, department or branch. Group by a different plan to answer a different question from the same data. The Project app also shows profitability per project from the same analytic items.
Why does my analytic report not match my profit and loss?
Almost always because some postings were never tagged with an analytic distribution. Those costs sit in the general ledger but not in the analytic view, so the analytic total is lower than the P&L and your projects look too profitable. The gap equals your untagged spend. Add distribution models on your main cost accounts so every posting carries a distribution automatically.